


The July 2021 Global Climate Summary from NOAA’s National Centers for Environmental Information was released on Friday, and among the highlights was that the planet’s hottest month of the year was also the hottest July in the 142-year record. From the report:

The July 2021 global surface temperature was 1.67°F (0.93°C) above the 20th-century average of 60.4°F (15.8°C) — the highest for July in the 142-year record. This value was only 0.02°F (0.01°C) higher than the previous record set in 2016, and tied in 2019 and 2020.

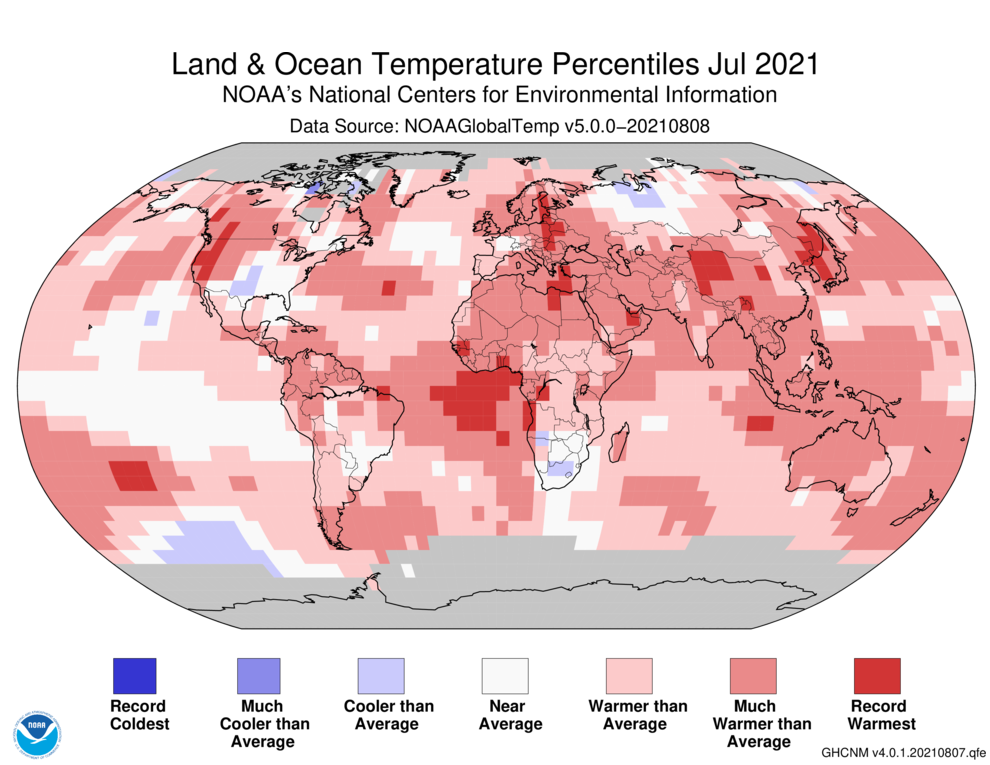
(top) Temperatures across the globe in July 2021 compared to the 1981-2010 average. Red areas were warmer than average; blue areas were cooler than average. (bottom) Temperatures each July since 1880 compared to the 20th-century average. Years that were cooler than average are red; years that were cooler than average are blue. The long-term warming trend is shown by the red line. NOAA Climate.gov image, based on data from NCEI.
Extreme—in some cases record-setting—heat dominated the headlines for the western United States and Canada, Northern and Eastern Europe, and Northeast China and Japan. There were at least a few areas were cooler than average, including the U.S. Southeast, Canada north of Hudson Bay, South Africa, and north-central Russia.
The graph shows how long it’s been since the planet had a July that was cooler than average. Based on data from NCEI’s Climate at a Glance Tool, the long-term warming trend for July is now 0.74 degrees Celsius per century (1.33 degrees Fahrenheit). That means the planet is about 1.05 degrees C (1.89 degrees F) warmer today than it was when the historical temperature record began in 1880. In addition, NCEI reported,

The seven warmest Julys have all occurred since 2015. July 2021 marked the 45th consecutive July and the 439th consecutive month with temperatures, at least nominally, above the 20th-century average.
Among the dozens of supplemental maps and graphs NCEI provides with each monthly report is a graph that experts call the annual temperature “horse race” graph.

Year to date temperatures through July for 2021 (black line) plus the running year-to-date temperatures for the 10 hottest years in the historical record (colored lines). Image by NOAA NCEI.
Here’s NCEI’s description of the image:
This graphic compares the year-to-date temperature anomalies for 2021 (black line) to what were ultimately the ten warmest years on record: 2016 (1st), 2020 (2nd), 2019 (3rd), 2015 (4th), 2017 (5th), 2018 (6th), 2014 (7th), 2010 (8th), 2013 (9th), and 2005 (10th). Each month along each trace [colored line] represents the year-to-date average temperature anomaly. In other words, the January value is the January average temperature anomaly, the February value is the average anomaly of both January and February, and so on.
2021 is running roughly in the middle of the pack. Based on analysis of how widely the year-to-date global temperature has been observed to vary over the remaining months of the year, NCEI concludes that it is virtually certain that the year will go on to rank in the top 10 warmest years on record.

Advertise with the mоѕt vіѕіtеd nеwѕ ѕіtе іn Antigua!
We offer fully customizable and flexible digital marketing packages.
Contact us at [email protected]


