


October 9, 2025. The Statistics Division, under the Ministry of Finance and Corporate Governance releases the CPI for Jul 2025 Year-on-Year Analysis

The Consumer Price Index rose by 1.2% for the twelve months ending July 2025. The Food and Non-Alcoholic Beverages index rose 1.0% after declining by 1.0% in June 2025. The All Items Less Food and Energy index increased by 1.3% over the same twelve months.
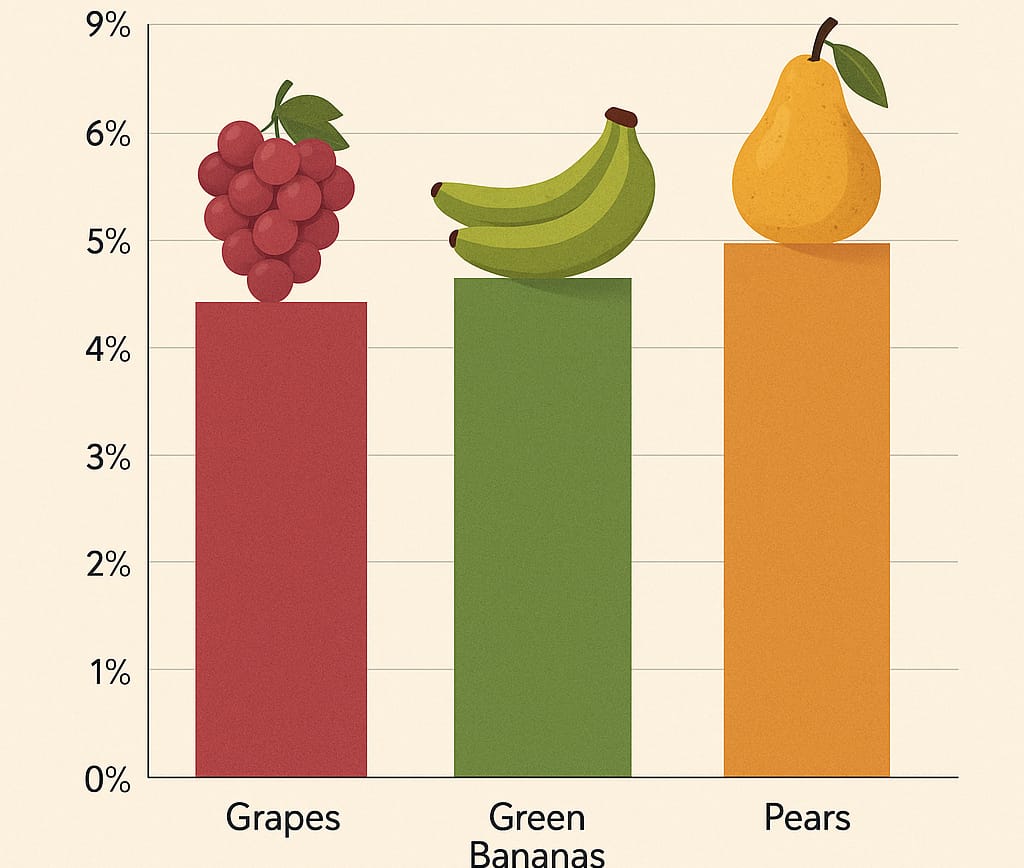
The Food index increased by 1.4% compared to the twelve-month period ending June 2025. The Food index had mixed outcomes, resulting from five increases and four decreases in the subcategories. The Food index was impacted primarily by increases in the index for Fruits (+14.6%), Meats and Meat Products (+4.8%), and Bread and Cereals (+3.3%). The two fruits subcategory increased as several items increased, including Red Seedless Grapes (+66.7%), Green bananas (+ 16.2%), Pears (+16.2%), Gala Apples (+3.5%), and Ripe Bananas (+2.9%).
The other two food subcategories that contribute to the increase include Milk, Cheese, and Eggs (1.9%) and Sugar, Jams, Honey, Chocolate, and Confectionery (1.1%).

The index for All Items Less Food and Energy rose 1.3%. This increase was primarily influenced by the increases in the indexes for Restaurants and Hotels (+7.4%), Transport Services (+7.3%), Health (+6.4%), and Alcoholic Beverages, Tobacco and Narcotics (+3.2%).
Month-to-Month Price Changes

he Monthly Consumer Price Index for July 2025 increased by 1.4% a further increase than the 1.0% in June 2025.
The index for food rose 1.0% in July, its second increase since April 0.2% increase. Seven of the nine major grocery store food group indexes increased in July. The index for Sugars, Jam, Honey, Chocolate, and Confectionery rose 3.6% with all three subcategories increasing.

The Milk, Cheese and Eggs rose 3.0% with the index for Preserved Milk and Other Milk Products/Powder/Evaporated/Condensed Milk having the largest impact. The index rose 5.3% over the one-month period.
The index Fish and Seafood increased 2.4% in July, with the indexes for Fresh Chilled or Frozen Fish and Seafood and Preserved or Processed Fish and Seafood increasing 3.3% and 2.1% respectively.
The index for All Items less Food and Energy rose 1.6 percent in July. The index for recreation and Culture rose 6.5% with the index for Games, Toys and Hoobies increasing by 50.6%. Similarly, the index for Transport rose 6.5 and was largely impacted by the index for Transport Services, which rose 20.4% in July. The index for Actual Rentals for Housing increased 1.9% over the month, while the index for Materials for the Maintenance and repair of dwellings increased by 3.2%.
Methodology
What is the consumer price index (CPI) measuring and how is it done?
The All Items Consumer Price Index (CPI) is the main measure of what is commonly called inflation, or headline inflation. It measures the change in prices, on average, from month to month, and from year to year of the goods and services bought by most households.
Prices are collected monthly and quarterly from supermarkets and other suppliers of goods and services. The pattern of household expenditure on these goods and services is derived from a regular household budget (or expenditure) survey (HBS). The prices and spending patterns (known as weights) are then combined to calculate the price indices for groups of goods and services and for the All Items index. These indices are based on expenditure patterns in 2006.
The All Items (or overall) index, with all of its twelve (12) component indices, is published each month.
For a detailed account of the methodology used in calculating the CPI, please call the Statistics Division.
Copies of the CPI for Jul 2025 can be accessed on the Division’s official website www.statistics.gov.ag
Advertise with the mоѕt vіѕіtеd nеwѕ ѕіtе іn Antigua!
We offer fully customizable and flexible digital marketing packages.
Contact us at [email protected]


