


Consumer Price Index (CPI)
Year-on-Year Analysis
Month-to-Month Price Changes

The Consumer Price Index rose 0.4% for the twelve months ending November 2025 after rising 1.6% over the twelve months ending October 2025.
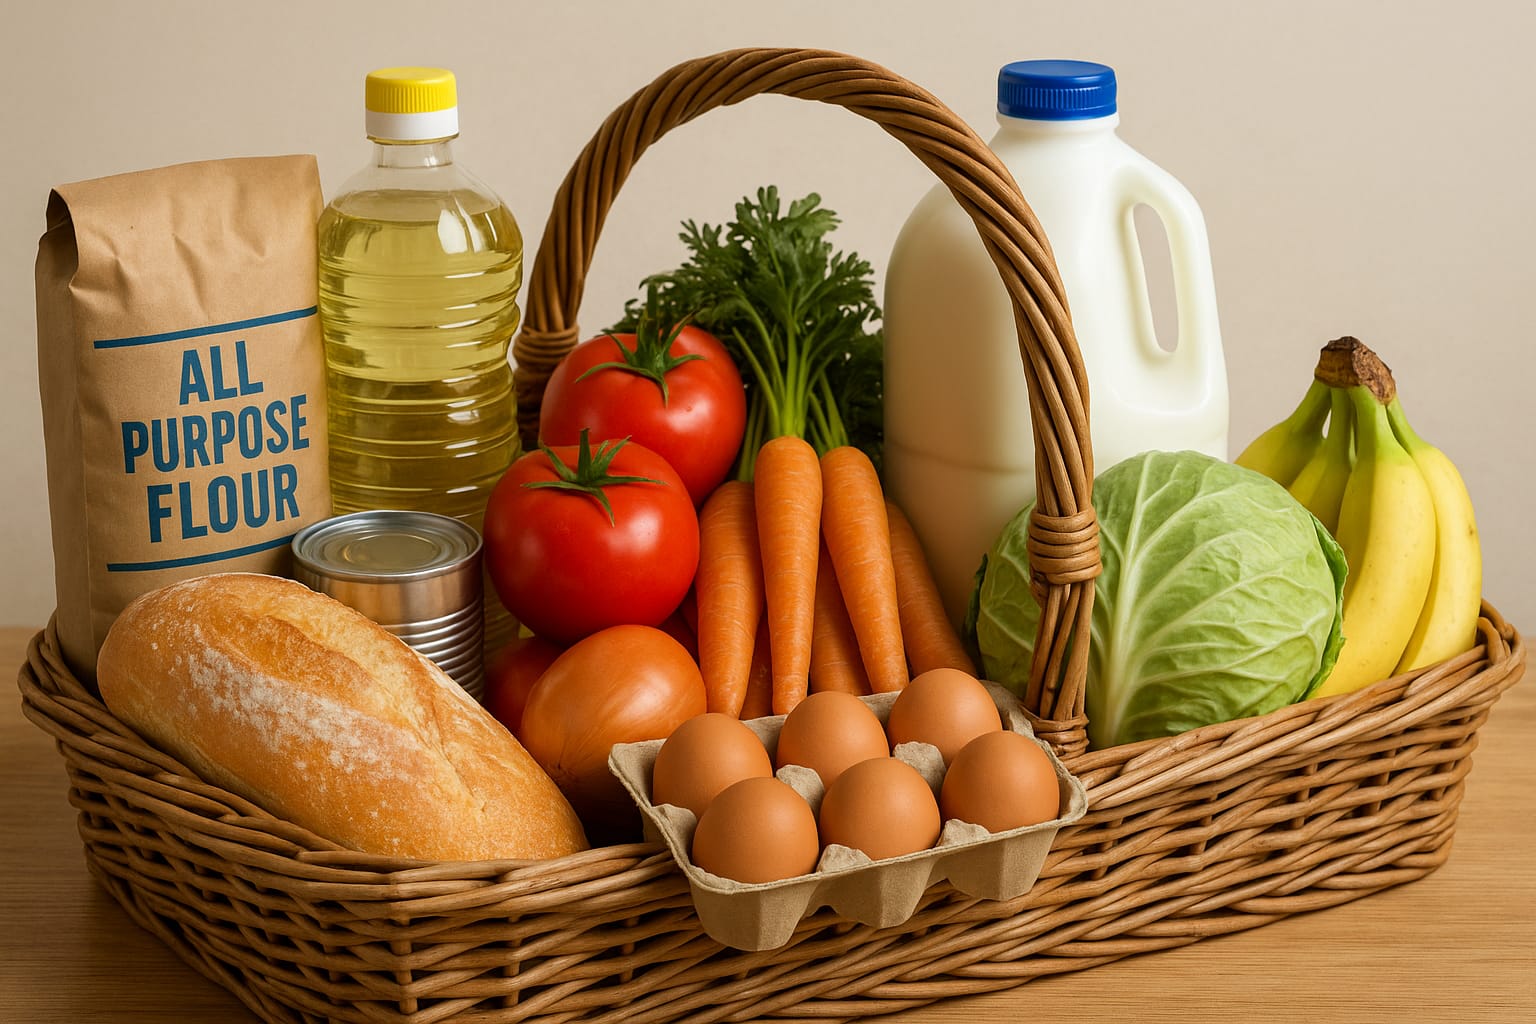
The index for Food and Non-Alcoholic Beverages decreased by 1.2% over the twelve-month period. The index for Food fell 1.2%. The indexes for Fruit, Vegetables, and Oils and Fats fell over the last twelve months, influencing the decrease in food inflation. In Contrast, four subcategories rose above one percent for the same period. The index for Bread and Cereals and Fish and Seafood both rose 1.0% while the index for Meat and Meat Products and Milk, Cheese and Eggs rose 1.5% and 1.8% respectively.

The index for Non-Alcoholic Beverages decreased by 0.7%.

Other signifcant decreases include Health (-6.8%), Furnishings, Household Equipment and Routine Household Maintenance (-3.3) and Transport (-1.6%).
The index for All Items Less Food and Energy rose by 0.4%. The index for Actual Rental for Housing increased 1.5% over the last year. The index for Education (+13.1%), Restaurants and Hotels (+5.1%), Alcoholic Beverages, Tobacco and Narcotics (+2.9%), and Communication (+2.6%).
What is the consumer price index (CPI) measuring and how is it done?
The All Items Consumer Price Index (CPI) is the main measure of what is commonly called inflation, or headline inflation. It measures the change in prices, on average, from month to month, and from year to year of the goods and services bought by most households.

Prices are collected monthly and quarterly from supermarkets and other suppliers of goods and services. The pattern of household expenditure on these goods and services is derived from a regular household budget (or expenditure) survey (HBS). The prices and spending patterns (known as weights) are then combined to calculate the price indices for groups of goods and services and for the All Items index. These indices are based on expenditure patterns in 2006.
The All Items (or overall) index, with all of its twelve (12) component indices, is published each month.
For a detailed account of the methodology used in calculating the CPI, please call the National Bureau of Statistics.
St John’s Antigua, January 15, 2026. The Statistics Division, under the Ministry of Finance and Corporate Governance releases the CPI for Nov 2025
Copies of the CPI for Nov 2025 can be accessed on the National Bureau of Statistics website www.statistics.gov.ag
November-2025
In November 2025, the Consumer Price Index (CPI) rose 0.3% compared to October 2025. The Food and Non-Alcoholic Beverages Index increased by 0.2% over the month.
The Food Index remained unchanged over the same one-month period. Five supermarket food groups recorded declines over the one month, but the decreases were offset by increases in four other categories, resulting in unchanged food inflation. Decreases were recorded for: Vegetables (-2.2%), Bread and Cereals (-0.9%), Milk, Cheese and Eggs (-0.8%), Meat and Meat Products (-0.4%).
In contrast, the index for Fish and Seafood (+5.3%), Oils and Fats (+2.5%), Food Products N.E.C (+2.5%) and Sugar, Jams, Honey, Chocolate and Confectionery (+0.9%) recorded increases.
The Non-Alcoholic Beverage Index increased by 1.7%.
The index for All Items less Food and Energy rose by 0.3% over the month. The increase was influenced by increases in the indexes for Recreation and Culture (+5.3%), Goods and Services for Routine Household Maintenance (+0.4%) and Education (+0.2%).
Facilitating Informed Decision Making!
ANTIGUA & BARBUDA MINISTRY OF FINANCE & THE ECONOMY
Issued by:
Statistics Division
Advertise with the mоѕt vіѕіtеd nеwѕ ѕіtе іn Antigua!
We offer fully customizable and flexible digital marketing packages.
Contact us at [email protected]


Tired reading this damn foolishness that’s not doing a thing for the ordinary man and woman. Just keep your figures and shuv it you know where
More damn manipulation of the Consumer Price Index (CPI) figures, eagerly released by the out of touch government.
Those of us who live in the real world and have to shop on a regular basis, will know this so-called percentage fall in the CPI figures is a load of nonsense. Also, it doesn’t take into account the increase of price gouging on particular popular food items – which if I remember correctly, weren’t the ABLP going to tackle vigorously? –
What happened to that?
Just like the earlier comment by @Clytie, I’m also “tired of reading this damn foolishness…”
Thank you @ Brixtonian they take us for fools. Not even their own supporters believe this crap.
Lol.
Hey let me do the math for this article.
1.2% of $10 is 12cents.
Are you kidding? Even a homeless person can find 12cents somewhere in their dirty rags.
Laughter is all I can really muster for this article.
Comments are closed.